
2021 PCAOB Large Firm Inspection Reports
- Daniel Goelzer
- Dec 29, 2022
- 14 min read
Updated: Jan 25, 2023
On December 19, the PCAOB released the 2021 inspection reports for the U.S. affiliates of the six global network audit firms. The overall percentage of these firms’ inspected audits that the PCAOB found deficient was 21 percent. Four of the six firms had a higher percentage than in 2020 of inspected engagements that were deficient; the other two firms – KPMG and BDO – had essentially unchanged deficient rates.
As was the case last year, PwC’s inspection results were the best in the group. In 2021, the Board found deficiencies in two out of 56 PwC audits it inspected – a deficiency rate of 3.6 percent; in 2020, the Board found only one deficient audit (2 percent) out of 52 PwC engagements inspected – an all-time record low for any Big Six firm. Deloitte maintained its second-place position, with seven engagements in Part I.A of its 2021 inspection report (13 percent of 54 engagements inspected). At the other end of the spectrum, BDO, as in 2020, had the highest percentage of deficient engagements – the Board found problems in 53 percent of the 30 engagements it inspected, down slightly from 54 percent last year. KPMG had the second-highest rate with 26 percent of inspected engagements cited for deficiencies.
From a big picture standpoint, the large firm 2021 inspection results are less favorable than in 2020, although the five-year trend for the six firms as a group is still positive. The percentage of engagements that inspectors found to include at least one deficiency in 2021 rose five percent (from 16 percent in 2020). The number of deficiencies per inspected engagement also rose from 0.64 deficiencies per inspection in 2020 to 0.77 in 2021. As in 2020, more than half of all deficiencies described in Part I.A of the six large firm reports related to the audit of internal control over financial reporting (ICFR). Seventy-two percent of engagements in Part I.A of the six inspection reports included at least one ICFR audit deficiency. (Regarding the five-year trend, see Comment 1, below.)
For last year’s analysis of the 2020 inspection reports of the six global network member firms, see 2020 PCAOB Large Firm Inspection Reports, November-December 2021 Update. For the PCAOB staff’s summary of all 141 2021 audit firm inspection reports, see Staff Update and Preview of 2021 Inspection Observations, discussed in PCAOB Staff 2021 Inspections Preview Reports Rising Deficiencies in this Update.
2021 Inspection Cycle Report Synopses
Part I.A of a firm’s inspection report describes audit deficiencies of such significance that it appeared to the PCAOB that the firm had not obtained sufficient appropriate audit evidence to support its opinion on the financial statements and/or ICFR of the public company under audit at the time the opinion was released. Part I.B of an inspection report describes instances of non-compliance with PCAOB standards or rules that do not relate directly to the sufficiency or appropriateness of the evidence supporting an audit opinion. Below is a synopsis of Part I.A and Part I.B the 2021 inspection reports for the six U.S. affiliates of the global network firms:
BDO USA, LLP. The PCAOB reviewed 30 BDO issuer audits, 15 of which were integrated audits of both the financial statements and ICFR. In 16 of the 30 audits (53 percent), the PCAOB staff identified deficiencies of such significance that it appeared that the firm had not obtained sufficient appropriate audit evidence to support its opinion. This compares to BDO’s 54 percent deficient engagement rate in 2020. Six of the 16 engagements in Part I.A included deficiencies related to both the audit of the financial statements and of ICFR; nine included only a financial statement audit deficiency; and one included only an ICFR audit deficiency. The PCAOB described 56 audit deficiencies (1.87 deficiencies per inspection) associated with 64 auditing standards in the 16 engagements in Part I.A. In Part I.B of the inspection report, the PCAOB identified nine instances of noncompliance with PCAOB standards or rules that did not relate directly to the evidence the firm obtained to support an opinion.
Deloitte & Touche LLP. The PCAOB reviewed 54 Deloitte issuer audits, 43 of which were integrated audits of both the financial statements and ICFR. In seven of the 54 audits (7 percent), the PCAOB staff identified deficiencies of such significance that it appeared that the firm had not obtained sufficient appropriate audit evidence to support its opinion. This compares to D&T’s 4 percent deficient engagement rate in 2020. One of the seven engagements in Part I.A included deficiencies related to both the audit of the financial statements and of ICFR; two included only a financial statement audit deficiency; and four included only an ICFR audit deficiency. The PCAOB described eleven audit deficiencies (0.20 deficiencies per inspection) associated with eleven auditing standards in the seven engagements in Part I.A. In Part I.B of the inspection report, the PCAOB identified eight instances of noncompliance with PCAOB standards or rules that did not relate directly to the evidence the firm obtained to support an opinion.
Ernst & Young LLP. The PCAOB reviewed 56 EY issuer audits, 48 of which were integrated audits of both the financial statements and ICFR. In twelve of the 56 audits (21 percent), the PCAOB staff identified deficiencies of such significance that it appeared that the firm had not obtained sufficient appropriate audit evidence to support its opinion. This compares to EY’s 15 percent deficient engagement rate in 2020. Nine of the twelve engagements in Part I.A included deficiencies related to both the audit of the financial statements and of ICFR; one included only a financial statement audit deficiency; and two included only an ICFR audit deficiency. The PCAOB described 64 audit deficiencies (1.14 deficiencies per inspection) associated with 70 auditing standards in the twelve engagements in Part I.A. (One of these engagements, Issuer A, contained 24 of the 64 total deficiencies.) In Part I.B of the inspection report, the PCAOB identified 27 instances of non-compliance with PCAOB standards or rules that did not relate directly to the evidence the firm obtained to support an opinion.
Grant Thornton LLP. The PCAOB reviewed 31 Grant issuer audits, 22 of which were integrated audits of both the financial statements and ICFR. In seven of the 31 audits (23 percent), the PCAOB staff identified deficiencies of such significance that it appeared that the firm had not obtained sufficient appropriate audit evidence to support its opinion. This compares to Grant’s 17 percent deficient engagement rate in 2020. Five of the engagements in Part I.A included deficiencies related to both the audit of the financial statements and of ICFR; one included only a financial statement audit deficiency; and one included only an ICFR audit deficiency. The PCAOB described 29 audit deficiencies (0.94 deficiencies per inspection) associated with 30 auditing standards in the seven engagements in Part I.A. In Part I.B of the inspection report, the PCAOB identified 23 instances of noncompliance with PCAOB standards or rules that did not relate directly to the evidence the firm obtained to support an opinion.
KPMG LLP. The PCAOB reviewed 54 KPMG issuer audits, 45 of which were integrated audits of both the financial statements and ICFR. In 14 of the 54 audits (26 percent), the PCAOB staff identified deficiencies of such significance that it appeared that the firm had not obtained sufficient appropriate audit evidence to support its opinion. KPMG’s deficient engagement rate was also 26 percent in 2020. Eight of the 14 engagements in Part I.A included deficiencies related to both the audit of the financial statements and of ICFR; two included only a financial statement audit deficiency; and four included only an ICFR audit deficiency. The PCAOB described 51 audit deficiencies (0.94 deficiencies per inspection) associated with 58 auditing standards in the 14 engagements in Part I.A. In Part I.B of the inspection report, the PCAOB identified 13 instances of noncompliance with PCAOB standards or rules that did not relate directly to the evidence the firm obtained to support an opinion.
PricewaterhouseCoopers LLP. The PCAOB reviewed 56 PwC issuer audits, 47 of which were integrated audits of both the financial statements and ICFR. In two of the 56 audits (4 percent), the PCAOB staff identified deficiencies of such significance that it appeared that the firm had not obtained sufficient appropriate audit evidence to support its opinion. This compares to PwC’s 2 percent deficient engagement rate in 2020. One of the engagements in Part I.A included deficiencies related to both the audit of the financial statements and of ICFR, and one included only a financial statement audit deficiency. The PCAOB described six audit deficiencies (0.11 deficiencies per inspection) associated with three auditing standards in the two engagements in Part I.A. In Part I.B of the inspection report, the PCAOB identified 13 instances of noncompliance with PCAOB standards or rules that did not relate directly to the evidence the firm obtained to support an opinion.
Comparison of Firm Part I.A Results
Table 1 compares the results of the 2021 inspections of the six firms. Table 2, which appeared in 2020 PCAOB Large Firm Inspection Reports, November-December 2021 Update, comparing the results of the 2020 inspections, follows the 2021 table.

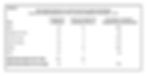
Tables 1 and 2 focus on the percentage of inspected engagements found to have at least one audit deficiency. Other indicators of the relative performance of the six firms are the number individual audit deficiencies in each report and the number of auditing standards associated with those deficiencies. These metrics differ from the percentage-of-deficient engagements measure because an engagement included in Part I.A may involve more than one deficiency and a deficiency may be associated with more than one auditing standard. Table 3 compares the performance of the six firms based on the number of audit deficiencies in each inspection report and the number of auditing standards associated with those deficiencies. (In some cases, there is an element of judgment in determining the number of deficiencies in a Part I.A engagement description.)

Aggregate Part I.A Data on Deficiencies, Standards, and Financial Statement/Audit Areas
The auditing standards most frequently cited as the basis for audit deficiencies in Part I.A of the 2021 inspection reports of the six firms are listed in Table 4. Table 4 also shows the percentage of all deficiencies in the six reports that were based on each auditing standard. The same auditing standard may have been cited multiple times in an engagement described in Part I.A. Only standards that were cited more than once in the six reports are included in Table 4.

In each inspection report, the PCAOB lists the most frequently identified audit deficiencies, divided between the most frequent deficiencies in financial statement (FS) audits and the most frequent deficiencies in ICFR audits. Table 5 aggregates these frequent deficiencies lists for the six firms. Table 5 also indicates what percentage of the engagements in Part I of the six reports included these deficiencies.

For each firm, the PCAOB lists the financial statement accounts or audit areas most frequently cited in Part I.A deficiencies in the inspection report. For the six firms, on an aggregate basis, these areas were:
Revenue and related accounts – 25 deficiencies
Inventory – 7 deficiencies
Allowance for credit losses/Allowance for loan losses – 4 deficiencies
Expenses – 4 deficiencies
Long-Lived Assets – 3 deficiencies
Equity and equity-related transactions – 3 deficiencies
Business combinations – 2 deficiencies
Going concern – 2 deficiencies
Investment securities – 1 deficiency
Comparison of Firm Part I.B Results
Part I.B of an inspection report describes deficiencies discovered in the inspection that did not directly affect the auditor’s opinion. In 2021, the PCAOB found an aggregate of 93 such deficiencies, compared to 64 in 2021. Table 6 presents the number of Part I.B deficiencies for each of the six firms and shows how each firm’s 2021 Part I.B results compare to its 2020 report. Firm-to-firm and year-to-year comparisons may provide insight into Part I.B trends but should be interpreted with caution. It appears that the PCAOB does not review all inspected engagements for every type of Part I.B deficiency. Therefore, the number of Part I.B deficiencies in a firm’s inspection report may not be directly comparable to the number in other firms’ reports or to the number reported in prior years.

Aggregate Part I.B Deficiency Data
Table 7 lists the most frequent Part I.B deficiencies in the six reports. Only deficiencies that were cited more than once are included.

Comments
The PCAOB cautions that inspection results are not necessarily comparable over time or among firms because of variations in the inspection process. While that caveat should be kept in mind, below are some observations based on the 2021 reports.
1. Overall, large firm audit quality appears to have marginally declined in 2021, but the longer-term trend is still positive (See Tables 1, 2, and 3). Audit quality seems to have fallen somewhat compared to last year. For the six global network firm affiliates as a group, the overall deficient engagement rate rose by one-third -- from 16 percent of inspected engagements in 2020 to 21 percent in 2021. For the Big Four, the deficient engagement rate rose from 12 percent in the 2020 reports to 16 percent in 2021. In addition, the inspectors found 0.77 deficiencies and referenced 0.85 auditing standards for each Big Six engagement they inspected in 2021, compared to 0.64 deficiencies per inspection in 2020.
However, in the context of the past five years, the 2021 inspection results are less troubling. The six firms’ aggregate 2021 deficiency percentage rate of 21 percent was lower than in any of the three years prior to 2020: 24 percent in the 2019 reports, 27 percent in the 2018 reports, and 30 percent in 2017 reports. Similarly, the Big Four’s 2021 performance was better than during 2017-2019: Twenty-two percent of the Big Four engagements inspected in 2019 contained deficiencies, as did 25 percent in 2018 and 31 percent in 2017. As to deficiencies per inspected engagement, most of the increase was attributable to a single firm – EY – and more than half of EY’s increase was attributable to a single engagement (Issuer A in its 2021 report).
2. There continue to be pronounced differences between the inspection results of the six large firms (See Tables 1, 2, and 3). This year, the gap between the firm with the lowest percent of inspected engagements that were deficient (PwC – 4 percent) and the firm with the highest percentage (BDO – 53 percent) was 49 percentage points. In 2020, the gap was 52 percent (2 percent for PwC versus 54 percent for BDO). While the difference narrowed slightly this year, the gap in inspection performance remains substantial.
As noted earlier, four of the six firms had higher Part I.A deficient rates in 2021, while BDO and KPMG, were basically unchanged. However, BDO and KPMG also continued to have the highest Part I.A deficiency rates in the group. Essentially, these two firms did not significantly improve, while the other four experienced modest decreases in their inspection results. Of course, the decline in PwC’s performance was relative to the record-setting one deficiency in its 2020 report; the two deficient PwC engagements in 2021 is still a very positive result, relative to the historical record.
There is also wide dispersion between firms based on the numbers of individual audit deficiencies and auditing standards cited in Part I.A of each report. In the 2021 PwC inspection, the inspectors found six audit deficiencies associated with five auditing standards in two Part I.A engagements out of 56 engagements inspected – an average of 0.11 audit deficiencies and 0.09 standards citations per inspected engagement. At Deloitte, 54 inspections revealed eleven deficiencies associated with eleven auditing standards in seven Part I.A engagements or 0.20 deficiencies and 0.20 standards citations per inspected engagement. At the other end of the spectrum, in 30 BDO engagements inspected, the staff found 56 deficiencies and cited 64 standards, an average of 1.87 audit deficiencies and 2.12 standards citations per inspected engagement – 17 times more deficiencies and 23 times more standards citations per inspected engagement than at PwC. In between these extremes, EY, Grant, and KPMG had deficiency-per-inspection rates of 1.14, 0.94, and 0.94, respectively.
3. Although the share of engagements selected for inspection on a random basis increased in 2021, the impact on inspection findings, if any, is unclear. As discussed in last year’s inspection summary (see 2020 PCAOB Large Firm Inspection Reports, November-December 2021 Update), during the last several years the PCAOB has increased the percentage of inspected engage-ments selected for inspection at random, rather than based on risk. This appears to be the case for both the six large firms and for the inspection universe as a whole. See Staff Update and Preview of 2021 Inspection Observations, cited above. In 2018, 18.7 percent of the six firm inspection selections were random. In 2019, that figure grew to 23.7 percent, and in 2020, 24.7 percent were random selections. In 2021, random selections rose sharply to 44.1 percent – almost half of all Big Six inspected engagements. The PCAOB argues that random selection makes it harder for firms to predict which audits will be reviewed.
Deficiencies are presumably less likely to be found in engagements selected at random than in those selected based on an assessment of the engagement’s inherent difficulty or risk. Therefore, one would expect the percentage of deficient engagements to decline as the share of inspections that are random increases. However, in 2021 that does not appear to have been the case, since the percentage of deficient engagements rose, despite the increase in random selections. Of course, it is possible that audit quality declined sharply in 2021 and that the shift to more random selections masked that decline. It is also possible the risk of audit deficiencies is spread fairly equally across the audit universe, and random selections are no more or less likely to uncover problems than are risk-based selections. Several more years of data will probably be necessary to draw conclusions on this point.
4. ICFR audit deficiencies still feature prominently in inspection reports but may have plateaued (See Tables 4 and 5). The inspectors found ICFR audit deficiencies in 19 percent of integrated audits they inspected, up from 14 percent in 2020, but down from 23 percent in 2019 and 26 percent in 2018. This year, 72 percent of all audit engagements in Part I.A of the Big Six reports included an ICFR deficiency. In 2020 and 2019, 77 percent and 81 percent, respectively, of Part I.A engagements included an ICFR deficiency. In 2020, 50 percent of the most frequently cited deficiencies affected the ICFR audit. In 2021, frequent deficiencies affecting the ICFR audit rose to 56 percent, essentially the same as in 2019. As in past years, AS 2201, An Audit of Internal Control Over Financial Reporting That is Integrated with An Audit of the Financial Statements, was the most frequently cited auditing standard in the six inspection reports by a wide margin.
5. Failure to evaluate accounting and disclosure and overreliance on controls were the most frequent issues in financial statement audits (See Tables 4 and 5). The PCAOB found deficiencies in the financial statement audits of 16 percent of the Big Six engagements it inspected in 2021, and 79 percent of Part I.A engagements included a financial statement audit deficiency. In 2020, 14 percent of inspected engagements had a financial statement audit deficiency, and 86 percent of engagements in Part I.A included a financial statement audit deficiency. The most frequent 2021 Part I.A deficiency affecting the financial statement audit was “Did not sufficiently evaluate the appropriateness of the issuer’s accounting method or disclosure for one or more transactions or accounts.” The most common financial statement audit deficiency in 2020 was the second most common in 2021: “Did not perform substantive procedures to obtain sufficient evidence as a result of overreliance on controls (due to deficiencies in testing controls).”
6. Critical audit matters (CAM)s and audit committee communications drove a sharp increase in Part I.B deficiencies (see Tables 6 and 7). A striking feature of the 2021 reports is the increase in the number of Part I.B deficiencies. In 2020, there were a total of 64 Part I.B deficiencies in the six large firm reports – 10.7 deficiencies per firm. In 2021, the total number of Part I.B deficiencies rose by almost 50 percent to 93 or 15.5 deficiencies per firm. It is not clear whether the increase reflects more underlying deficiencies or simply more PCAOB focus on Part I.B issues. Either way, however, issues like CAM reporting, audit committee communications, and completeness of work papers are likely to draw PCAOB attention in 2023.
The Part I.B issue with the most findings in 2021 was the failure of the engagement team to perform procedures to determine whether particular matters related to material accounts that were communicated to the audit committee should have been disclosed as CAMs in the auditor’s report. The second most frequent Part I.B deficiency was the failure to make required communications to the audit committee related to the names, locations, and responsibilities of other accounting firms or persons that performed audit procedures. Since both of these issues touch on the auditor’s relationship with the audit committee, committees may be particularly interested in exploring breakdowns in these areas with their auditor.
* * *
Audit committees should discuss their audit firm’s inspection report with the engagement partner. As noted in past years, the audit deficiency descriptions and auditing standard deficiency tables could be used as a discussion topic checklist. Audit committees may also want to understand how the auditor addressed, or plans to address, engagement deficiencies highlighted in its report and whether the report will result in any changes in audit procedures that could affect the company’s audit. Of course, if the company’s engagement was the basis for a Part I.A or Part I.B finding, the audit committee should understand in depth the cause of the deficiency and how the auditor plans to remedy it and prevent a recurrence.